Portland, Oregon Real Estate Market News
|
 |
|
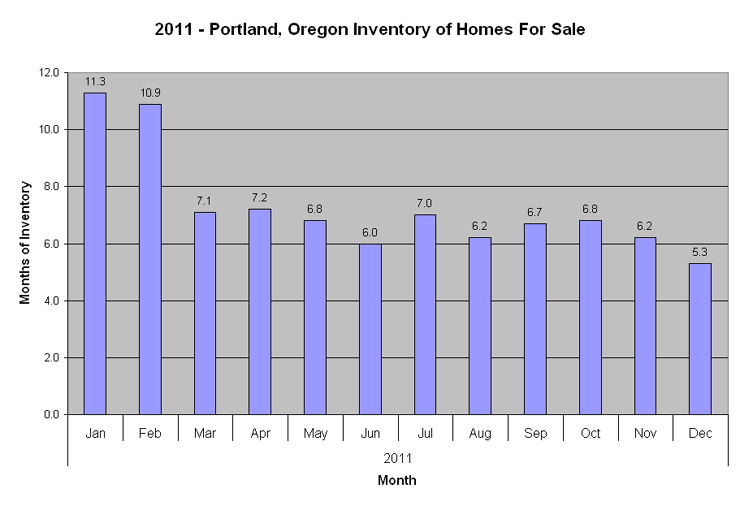
Inventory and Total Market Time: Inventory increased to
0.9 months in July. Total market time decreased to 20 days. |
|
|
Click
here for more detailed information for each month 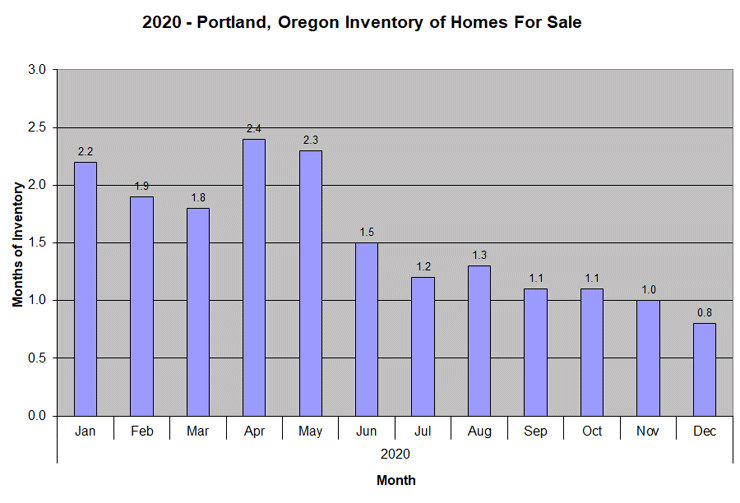 |
|
2020 Portland Residential Highlights: According to the
Regional
Multiple Listing Service new listings (1,740) increased
37.0% from the 1,270 listed in December 2019, and decreased 22.3%
from the 2,238 listed in November 2020. Pending sales (2,003)
increased 13.0% from the 1,772 offers accepted in December 2019,
and decreased 21.7% from the 2,557 offers accepted in November
2020. Closed sales (2,789) increased 26.0% from the 2,213 closings
in December 2019, and increased 1.6% from the 2,745 closings in
November 2020. |
|
|
 |
|
2019 Portland Residential Highlights: According to the
Regional
Multiple Listing Service New listings, at 1,270, increased
1.2% from December 2018 (1,255) and fell 40.0% from November 2019
(2,118). Pending sales (1,772) increased 10.8% over the 1,599
offers accepted in December 2018, and fell 22.1% short of the
2,274 offers accepted last month in November 2019. Closed sales
(2,213) rose 19.9% from the 1,846 closings recorded last year
in December 2018 and increased 1.0% compared with the 2,191 closings
recorded last month in November 2019. |
|
|
 |
| 2018 Portland Residential Highlights: According to the
Regional
Multiple Listing Service December brought cooling across the
board to the Portland metro area. Pending sales, at 1,599, fell
9.0% short of the 1,757 offers accepted last year in December 2017
and 16.0% short of the 1,904 offers accepted last month in November
2018. Closed sales (1,846) fared similarly, ending 21.4% lower than
in December 2017 (2,350) and 13.9% lower than in November 2018 (2,144).
This is the coolest December for closings in Portland metro since
2013, when 1,821 were recorded. New listings, at 1,255, cooled 22.4%
from December 2017 (1,617) and 45.7% from November 2018 (2,310).
Total market time rose to 64 days in December, with inventory decreasing
slightly to land at 2.5 months. Year to Date Summary: Activity in 2018 was mixed compared to 2017. New listings (41,287) increased 1.2%. Pending sales (29,809) decreased 4.9% and closed sales (29,771) decreased 5.9% this year. Average and Median Sale Prices: Comparing 2018 to 2017 through December, the average sale price rose 5.5% from $428,700 to $452,400. In the same comparison, the median sale price rose 5.3% from $379,900 to $400,000. |
|
|
 |
|
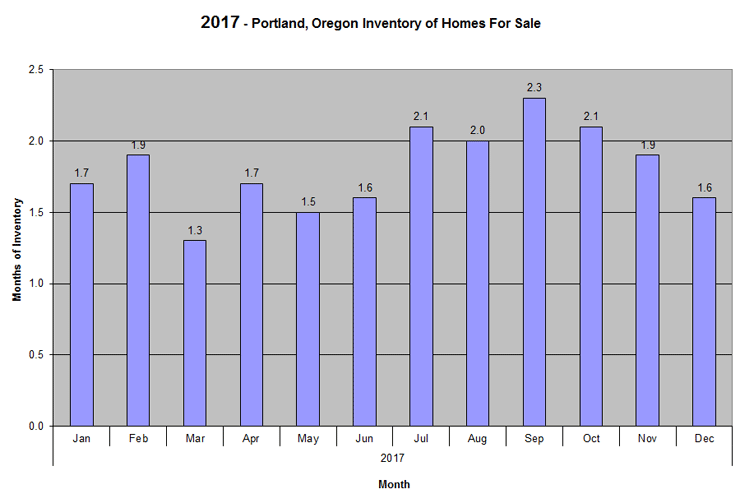
Year to Date Summary: Activity in 2017 was a little cool
compared to 2016. New listings (40,805) decreased 0.8%, closed
sales (31,624) decreased 3.6%, and pending sales (31,330) decreased
5.7%. |
|
|
|
|
 |
|
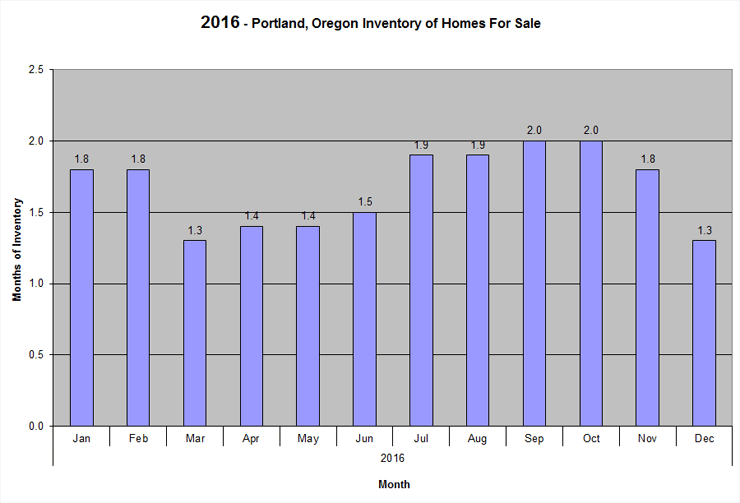
Year to Date Summary: Activity was cooler in 2016 than
in 2015. Comparing all of 2016 to 2015, new listings (41,121)
increased 0.7. Closed sales (32,798) decreased 1.5% and pending
sales (33,234) decreased 3.9%. |
|
|
|
|
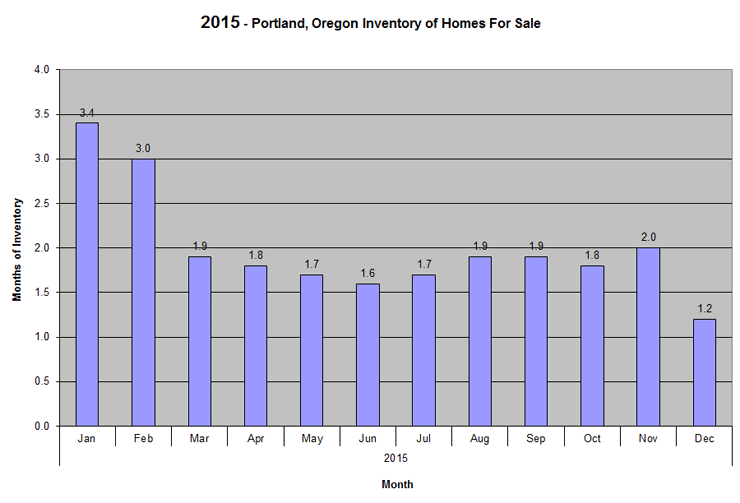 |
| Year to Date Summary: Activity across the board was higher
in 2015 than in 2014. Pending sales (34,568) rose 22.5%, closed
sales (33,307) rose 20.0%, and new listings (40,815) rose 8.4% for
the year. Average and Median Sale Prices: Prices were higher in 2015 compared to 2014. Comparing each year, the average sale price rose 6.5% from $333,000 to $354,500. In the same comparison, the median sale price rose 7.9% from $285,500 to $308,000. |
|
|
|
|
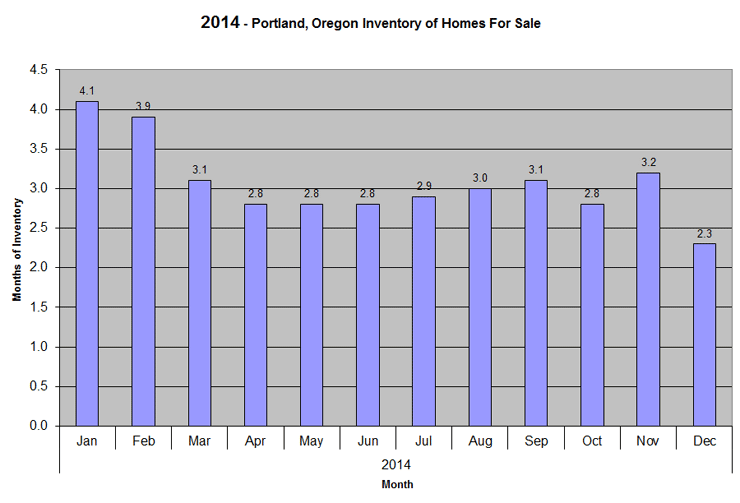 |
| End-of-Year Summary: Portland metro activity ended 2014
higher than 2013 numbers in all measures. New listings (37,654)
were up 5.0%, pending sales (28,220) were up 4.3%, and closed sales
(27,752) were up 3.6% during the entirety of 2014 compared to the
same time period in 2013. Average and Median Sale Prices: Prices were higher in 2014 than in 2013. The average price in 2014 was $333,000, up 7.2% from 2013 when the average was $310,600. In the same comparison, the median also rose 7.7% from $265,000 in 2013 to $285,500 during 2014. |
|
|
| Click here for more detailed information for each month |
|
|
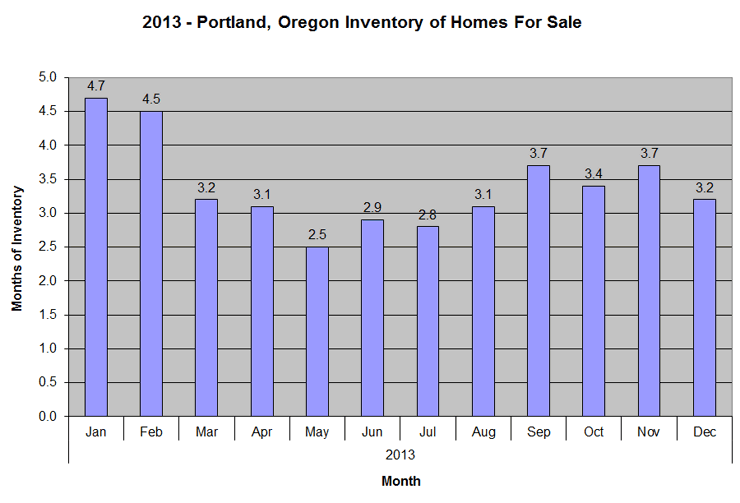 |
| 2013 Summary: There have been 27,065 accepted offers and 26,782 closed sales to date in 2013, up 12.7% from 24,010 pendings and 14.3% from 23,438 closed sales in the same period last year. The 35,858 new listings to date this year represent a 11.0% increase from the 32,300 entered through the end of last year. Average and Median Sale Prices: The average sales price through the end of the year is $310,600, up 12.9% from the same period in 2012, when the average was $275,000. In the same comparison, the median price increased 12.8% from $235,000 last year to $265,000 to end 2013. |
|
|
|
|
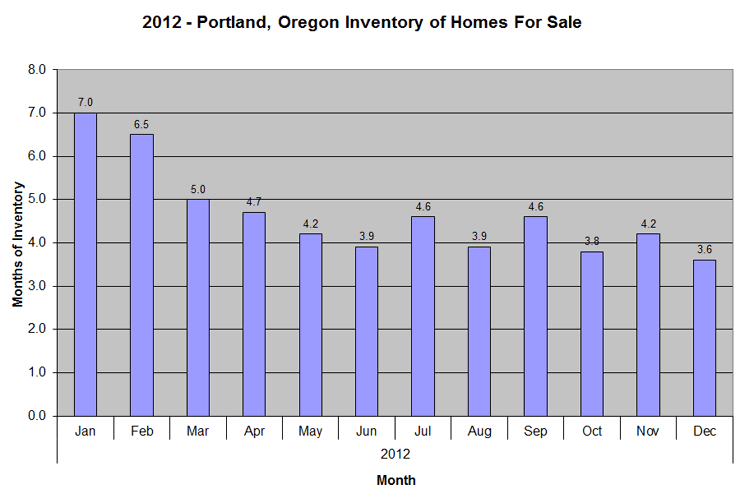 |
| 2012 Summary: There were 32,300 new listings, 24,010 accepted offers, and 23,438 closed sales in 2012. Compared to the same period last year, new listings are down by 5.2% from the 2011 listing count of 34,084. Pending sales are up 16.2% from 20,670 last year. Closed sales are up 19.1% from 19,682. Prices are higher. The average sale price in 2012 was $275,000, 4.4% higher than the average price of $263,300 in 2011, while the 2012 median sale price of $235,000 was 6.3% higher than the 2011 median of $221,000. Total market time dropped 21.5% from 143 days last year to 112 days in 2012. The average price increase and the improved number of sales has resulted in a healthy increase in the total dollar volume of sales, which rose to $6.45 billion in 2012 from $5.2 billion in 2011 and $5.3 billion in 2010. |
|
|
| Click here for more detailed information for each month |
|
|
|
|
|
|
| Click here for more detailed information for each month |
|
|
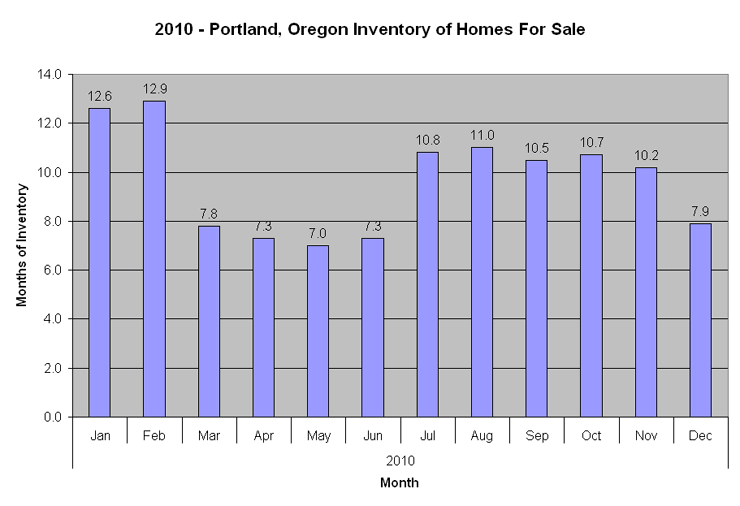 2010 Summary: When comparing activity in 2010 with that of 2009, closed sales dipped 0.2%. Pending sales were 2.1% lower, but new listings were up 3.0%. Total sales volume for 2010 was $5.3 billion, down from $5.5 billion in 2009. |
|
|
| Click here for more detailed information for each month |
|
|
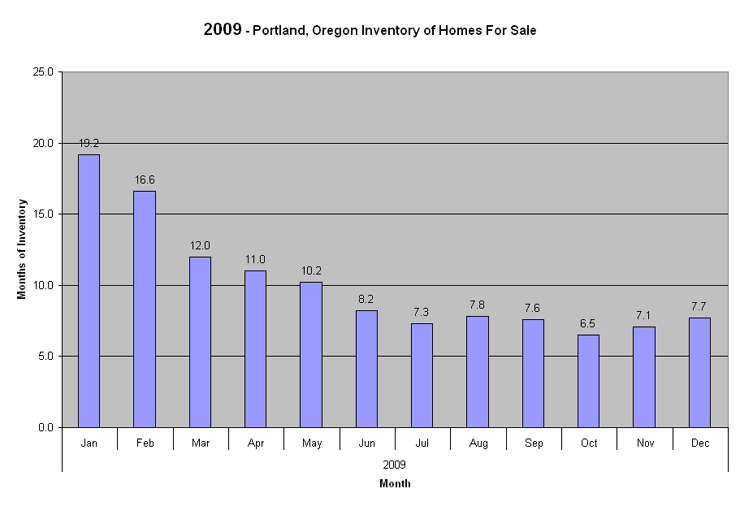 2009 Summary: Comparing activity from 2009 with that of 2008, pending sales increased 4%. Closed sales were 0.9% short of the 2008 total. New listings fell 18.8%. Total sales volume for 2009 was $5.5 billion, down from $6.3 billion in 2008, and $9.7 billion in 2007. |
|
|
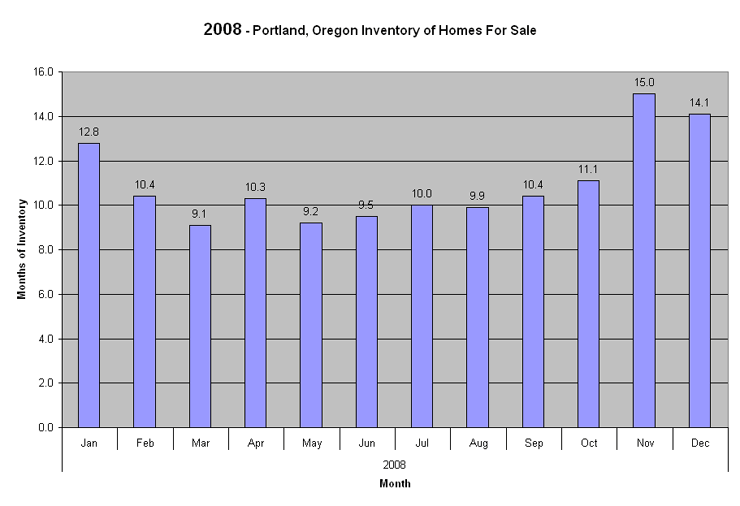 2008 Summary: Comparing market activity in 2008 with 2007, new listings decreased 8.7%. Pending sales dropped 30.8% and closed sales fell 32.1%. At $6.3 billion this year, total sales volume dropped 35% from 2007. |
|
|
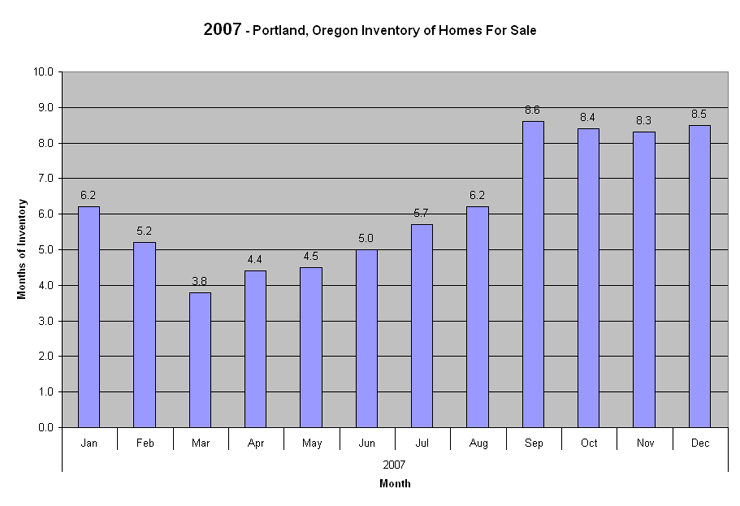 2007 Summary: Comparing market activity in 2007 with that of 2006, the Portland metro area saw an 8.1% increase in new listings. However, pending sales decreased 15.7% and closed sales dropped 13.1%. Portland had its third highest total sales volume in residential real estate, at $9.7 billion, a 6.7% decrease from the $10.4 billion in 2006. The average sale price increased 6.3% ($342,900 v. $322,600) and the median sale price appreciated 7.2% ($290,000 v. $270,500). |
|
|
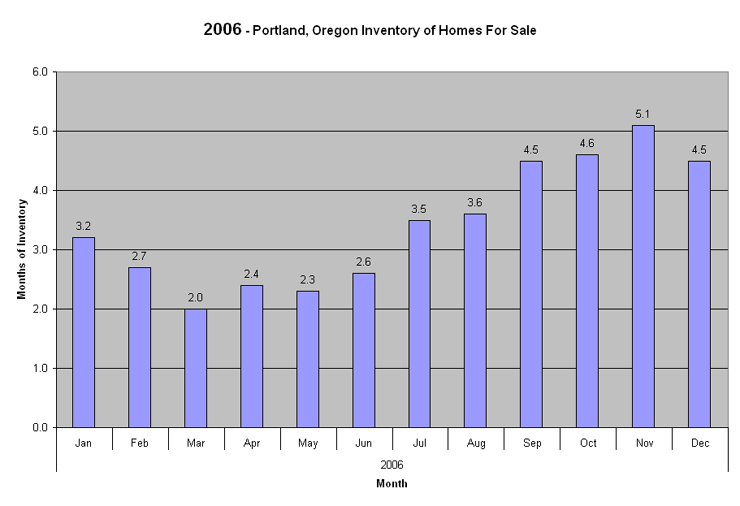 2006 Summary: In 2006 there were 14% more new listings when comparing market activity in 2006 with that of 2005. However, pending sales decreased 13.6% and closed sales fell 13.4%. Portland had its second highest total volume in real estate sales in 2006 with $10.4 billion compared to $10.6 last year. Further, the average sale price increased 14% (322,600 v. 282,900) and median sale price appreciated 13.9% ($270,500 v. $237,500). |
|
|
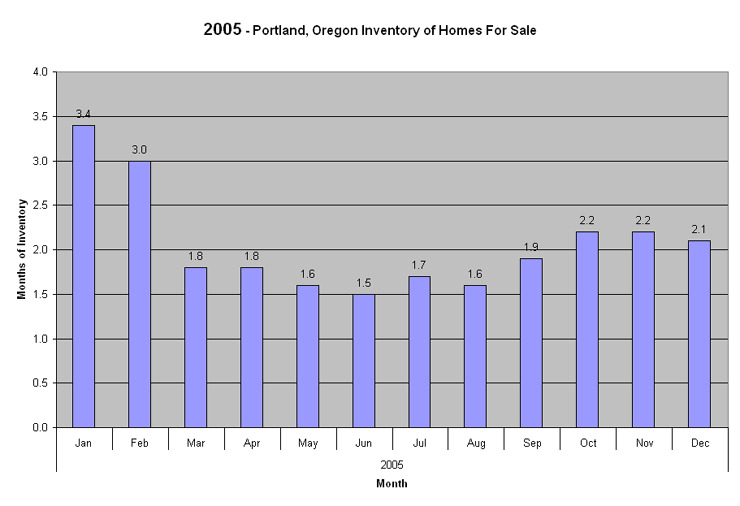 2005 Summary: 2005 Year’s end saw an increase in overall market activity with 13.1% more closed sales, a 10.7% increase in accepted offers and a 5.9% greater number of new listings when compared with 2004. Further, we had a record breaking total volume in real estate sales of $10.6 billion. Compared with 2004’s $8.1 billion that is an increase of 30.9%. The 15% increase in average sale price ($282,900 v. $246,000) and the 15% appreciation of median sale price ($237,500 v. $204,500) may also account for the increase. |
|
|
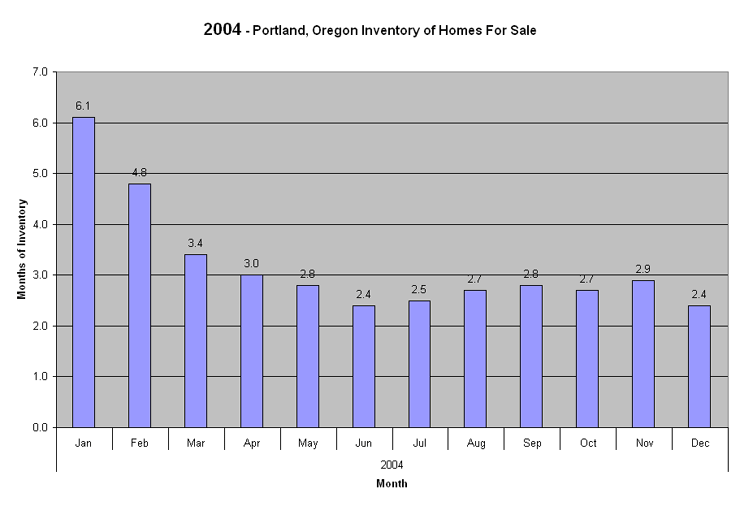 At year’s end 2004, the Portland metro area observed 8.3% more accepted offers than it had in 2003 Closed Sales also increased 6.6% . However, 2004 realized a small decline in new listings, which were down 2.9% from 2003. 2004 was a landmark year for the Portland metro area due to the fact that real estate sales that closed in the Portland metro area generated $8.1 billion. Compared to 2003’s $6.9 billion that is a sizeable increase of 17%. The 10.6% rise in average sale price ($246,00 v. $222,500) may account for a portion of the net increase. Furthermore, the telltale 9.4% appreciation of median sale price ($204,500 v. 187,000) may also account for the rise in total volume. |
|
|
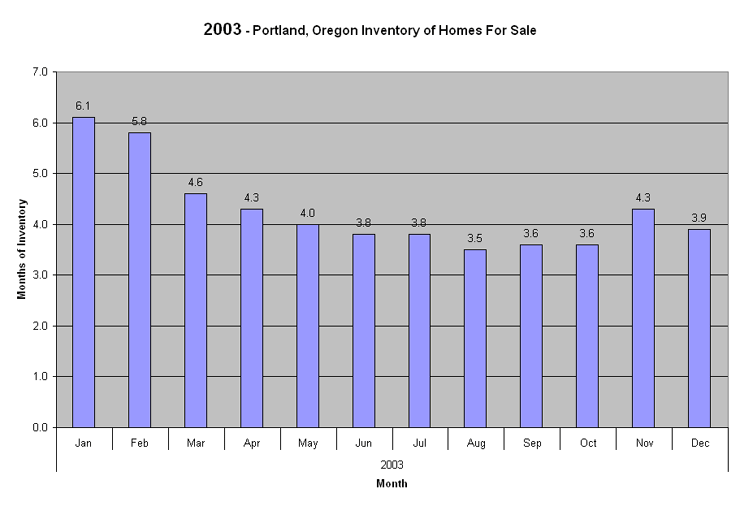
At 2003 year’s end, the Portland metro area had generated 2.2% more new listings than it had in 2002. The only year to have generated more new listings was 1998. No earlier record matched the area’s 2003 performance for generating pending sales (up 10.2% from 2002) and closed sales (up 12.0% from 2002). Sales that closed in 2003 generated a dollar volume of $6.9 billion. Contrast that with the $5.8 billion generated last year and you’ll witness the increase of 19.0%. The jump in closed sales can account for part of that increase, but so can the 5.8% rise in average sale price ($222,500 v. $210,300) and the 5.1% appreciation of median sale price ($185,000 v. $176,500). |
|
|
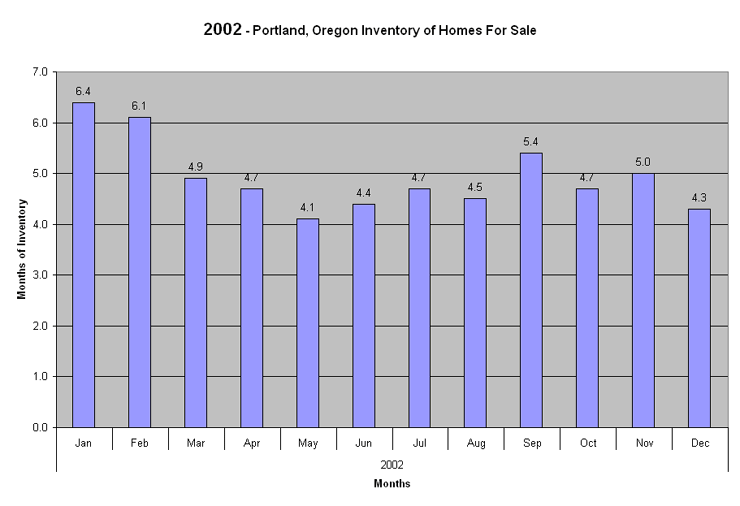 In 2002 new listings rose 1.9%, regaining all of the ground lost in 2001. Other categories pioneered new territory. Closed sales are higher than ever, and, compared to 2001 alone, increased by 3.2%. Pending sales showed the same trend, increasing by 2.2%. All of that closing activity resulted in $5.8 billion of residential real estate activity, an increase of 6.9% over last year’s total of $5.4 billion. Aiding the increase in dollar volume was the increase in the area’s average and median sales prices. Average price for the twelve months of 2002 climbed by 4.8% compared to 2001. Median price climbed 4.1% during the same period. |
|
|
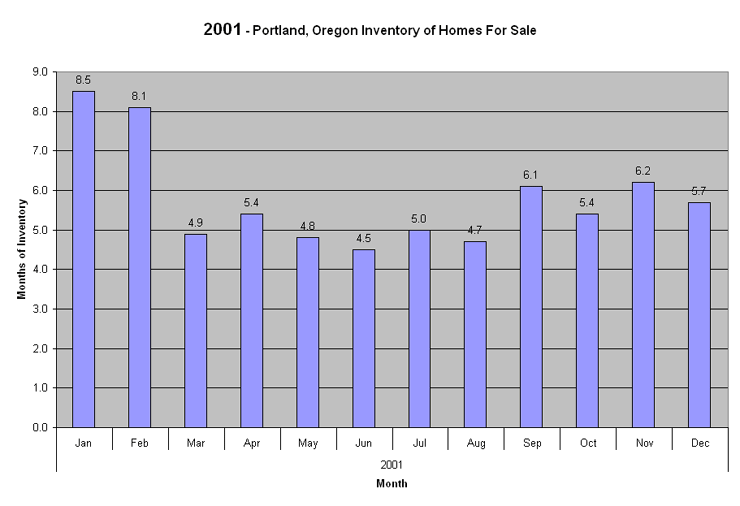 The year 2001 saw $5.40 billion in residential real estate sales for the Portland metro area, up $500 million from the volume for 2000. Strong growth in the number of closed sales made 2001 a record year. The 26,845 reported sales represent growth of 8.9% from 2000 and more sales than any previous year. Pending sales grew by a similar margin, up 9.1%. New listings, however, fell 1.6%. The number of new listings entered into RMLS™ (45,298), has not been so low since 1996. Comparing 2001 to 2000, average sales price appreciated 1.2% to $201,000—the first time it has grown past $200,000. Median sales price has appreciated 2.3%, to $169,900. |
|
|
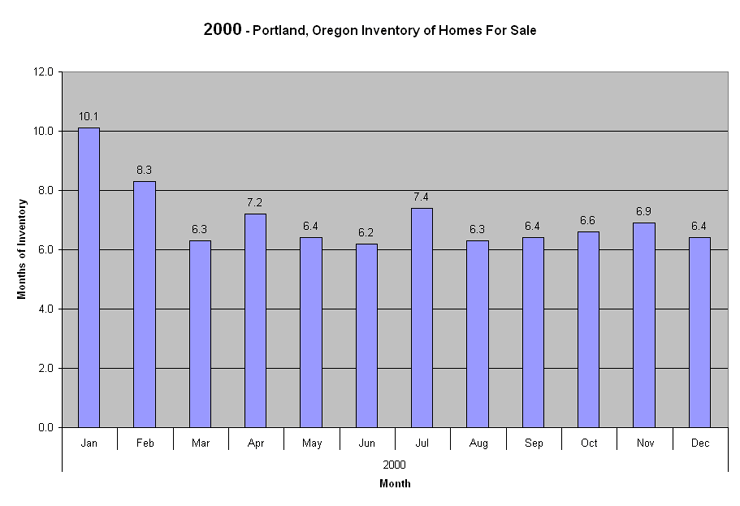 Approximately $4.90 billion in residential real estate sales occurred in 2000, up about $100 million from the previous year. A 3.1% decline in the number of closed sales was more than offset by the appreciation rate of 5.3% in average sales price. In dollar volume, 2000 was the best year in RMLS™ history to date. In other measures of market activity, 2000 was very similar to 1999. There were 2.1% fewer new listings in 2000 than in 1999 and 1.2% fewer accepted offers. The average sales price in the Portland market is creeping steadily towards the $200,000 mark, ending at $198,600 for the twelve months of 2000. The median sales price for 2000 was $166,000, a 3.6% increase over the $160,200 median in 1999. |
|
|
| Click here for more detailed information for each month |
|
|

